
Observability & Audit
Overview
Governance only works if you can see what actually happens. The Console gives you four windows into your tenant: usage dashboards (what does AI activity cost, per space and model), traces (every individual model call), the event log (who changed what in the tenant), and the skill-execution audit (every skill run). All four have API equivalents for feeding your own tooling.
Usage dashboards
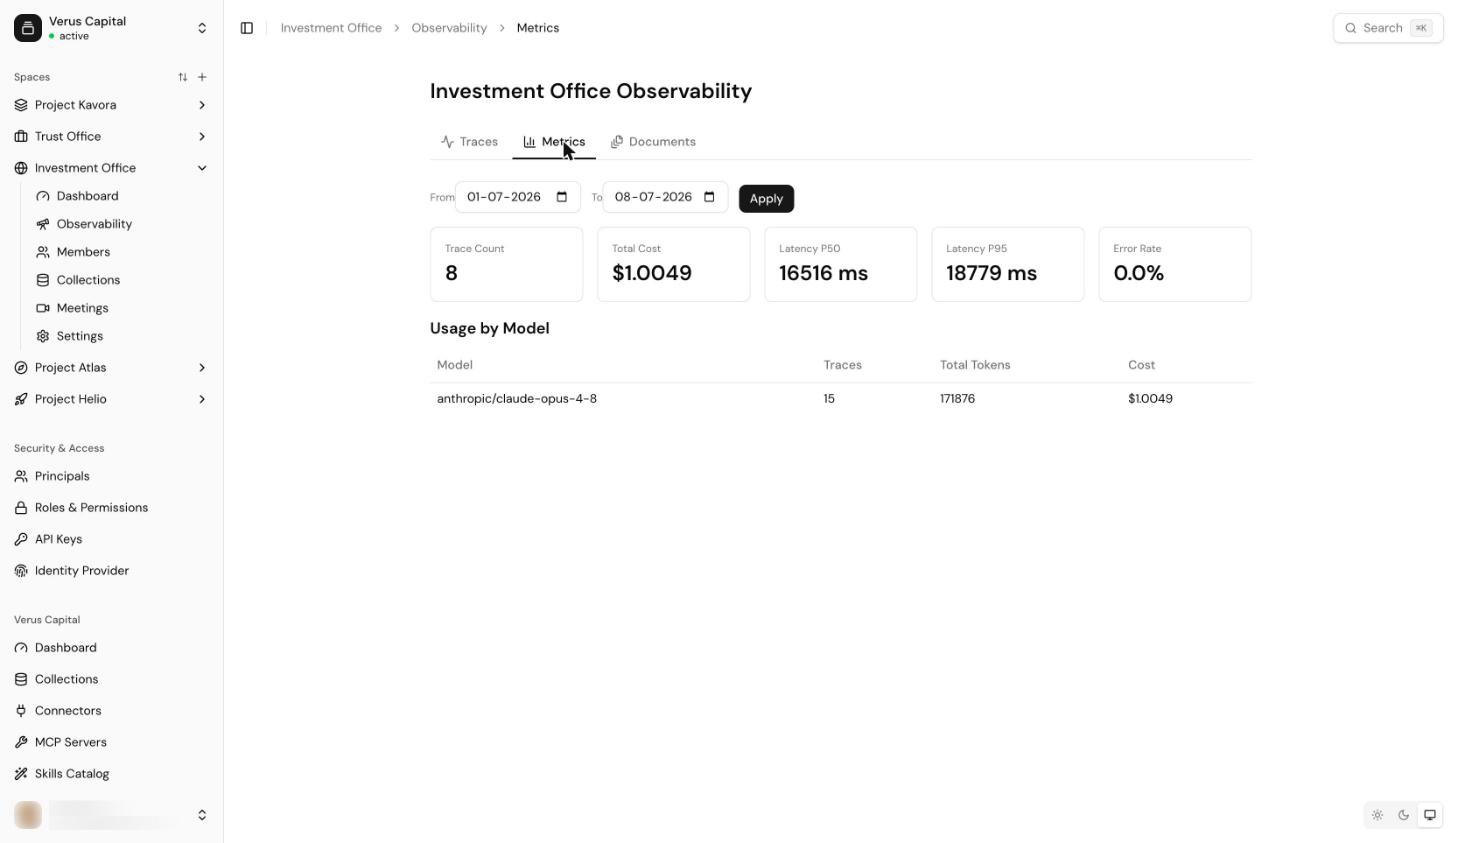
Observability in the Console sidebar opens the tenant dashboard: pick a date range (From / To → Apply) and you get the tenant totals — traces, cost, average latency, success rate and tokens per trace — plus traces-per-day and model-usage breakdowns. Each space has the same view scoped to itself (space → Observability).
If the dashboard warns "Some spaces failed to load", the shown totals are incomplete for the listed spaces — retry before drawing conclusions.
Traces
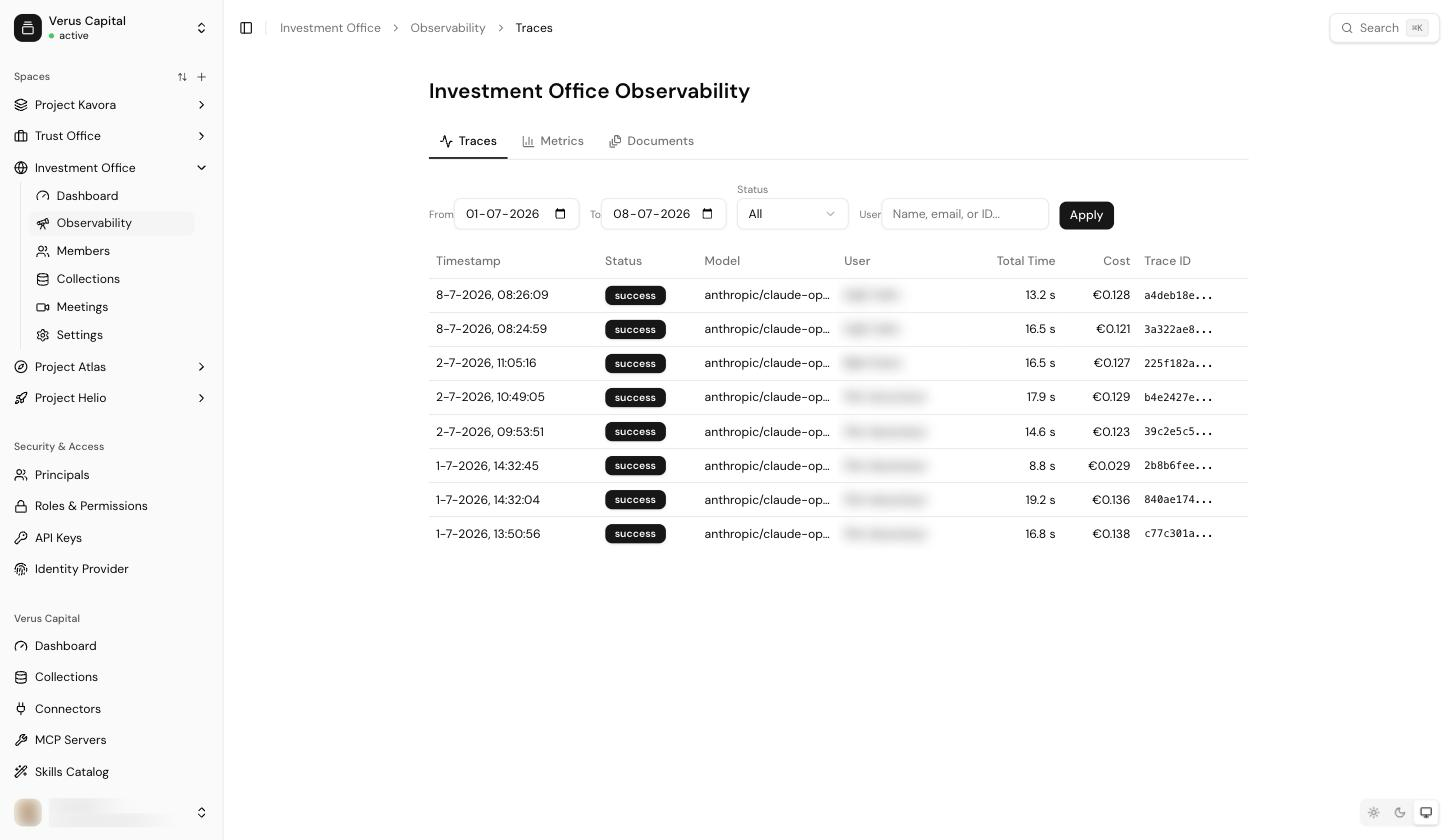
A space's Observability page has a Traces tab: every model call with its timestamp, status (success / failure / unknown), model, user, total time, cost and trace ID. Filter by date, status or user, and click a trace to open the detail panel with the full request breakdown.
Traces are the debugging bridge to the API: the X-Request-Id /
X-Trace-Id headers returned on API calls (see
Integration) match the trace IDs here, so a customer
report can be traced to the exact call.
The event log
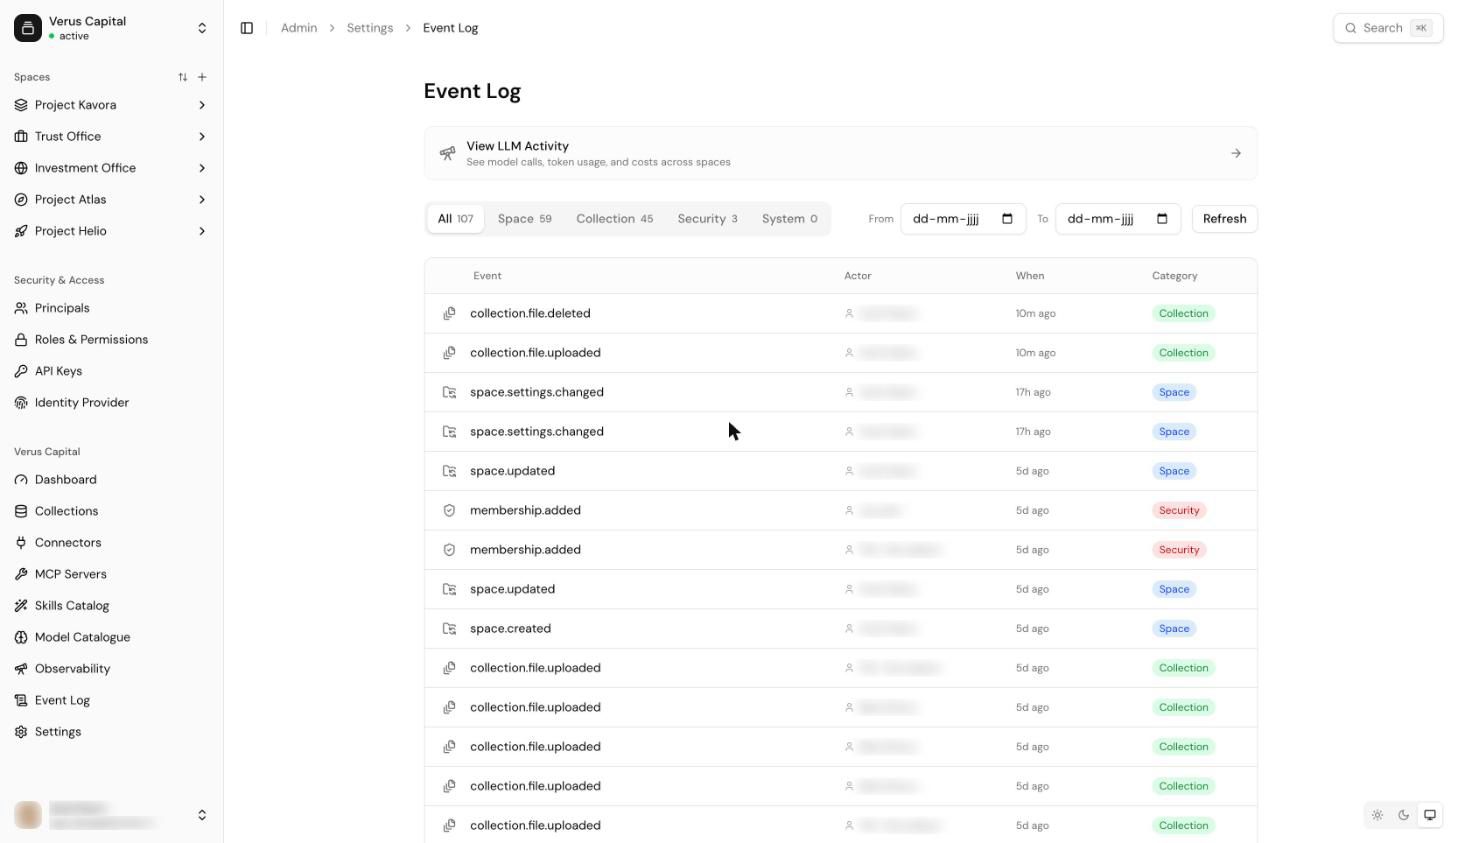
Event Log in the Console sidebar is the tenant's audit trail: every administrative and security-relevant action, append-only. Events are grouped in four categories — space, collection, security and system — with count badges, date filtering, and an expandable detail per event showing the actor, resource, timestamp and event metadata.
Use it for compliance questions ("who deleted that collection?"), incident review, and verifying that configuration changes happened when and by whom you expect. For continuous export to a SIEM or archive, the same data is queryable over the API — see Notifications & Events.
Skill-execution audit
Skill runs have their own audit: Skills Catalog → Audit log lists every execution in the tenant with state, duration, cost and source, filterable by skill, space, user and date, with CSV export. It's covered in Building and Deploying Skills.
Metering and billing
The dashboards read from your tenant's observability backend; the same numbers drive usage & metering over the API, including the billing usage-export endpoint for reconciliation. If dashboards stay empty, verify the tenant's observability configuration (Observability domain).
Tip: set a weekly rhythm — dashboard for cost trends, event log
filtered on security for anything unexpected. The API versions of both
exist precisely so you can automate that check.